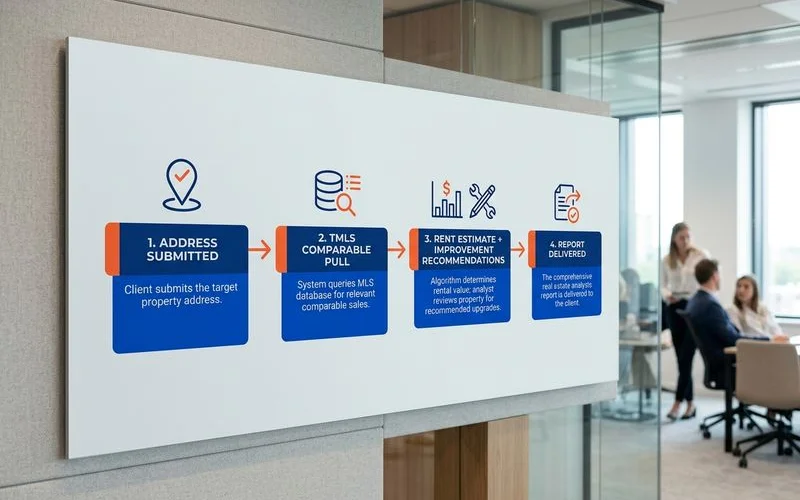
You know how challenging it is to transition from researching an investment to actually signing a lease with a great tenant. We built Durham Elite Property Management with a simple mission: to provide exceptional property management services that customers can truly rely on. Getting a free rental analysis Durham investors rely on is the first step toward making that transition easier.
Recent 2026 data from RentCafe shows the average apartment rent in Durham sits right around $1,533. Our team knows that a city-wide average is not enough to accurately price a specific single-family home or townhouse. You need neighborhood-level clarity.
Let’s look at the data, what it actually tells us, and explore a few practical ways you can respond.
Why We Offer Free Rental Analyses
We provide this complimentary report to bridge the gap between your preliminary research and a concrete management decision. This analysis delivers the exact same Doorify Multiple Listing Service figures required to calculate a precise rental property valuation Durham owners need.
Our data covers 16 counties across the greater Triangle region. You receive professional-grade insights with zero obligation to sign a contract.
Most local real estate investors find immense value in the baseline numbers, regardless of their next steps.
What’s in the Analysis
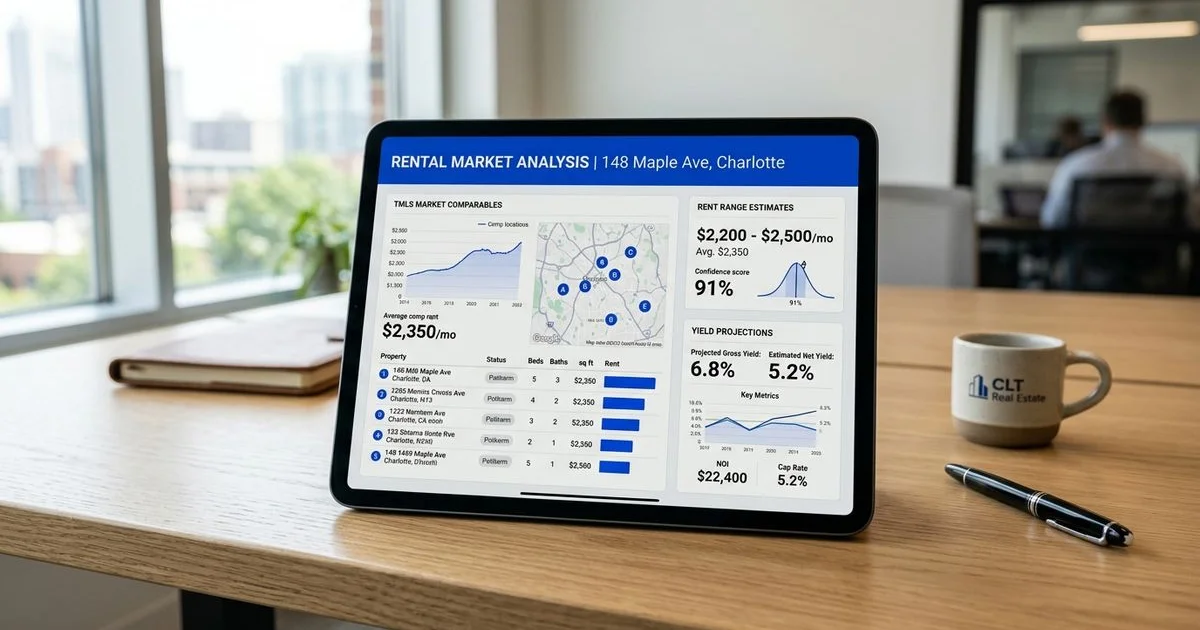
Our report contains a detailed comparable-rentals pull, an estimated monthly rent range, projected days-on-market, ROI-boosting recommendations, and a yield projection. You might be asking yourself, what is my home worth in rent?
We break the findings down into these core components to answer that exact question:
- TMLS comparable-rentals pull. Analysts pull recently rented and currently listed properties similar to yours. The system matches the submarket, bedroom count, square footage, and age to establish the actual market floor and ceiling.
- Estimated monthly rent range. Your specific dollar range relies on the comp pull. We then adjust the baseline for unique features like a renovated kitchen or a fenced yard.
- Projected days-on-market. This metric shows how quickly a well-priced unit should lease in current conditions.
- ROI-boosting improvement recommendations. Smart renovations dictate where your next dollar of rehab spend moves the most rent. A 2026 report from Yavapai Realty shows that a minor kitchen remodel, like refacing cabinets and adding quartz countertops, can yield up to a 96% return on investment. Industry data from BCG Real Estate Group confirms that swapping old carpets for luxury vinyl plank flooring is another proven way to attract high-quality renters.
- Gross and net yield projection. The annualized rent divided by the purchase price gives you the gross yield. Our final net yield calculation subtracts standard expenses like maintenance reserves, taxes, insurance, and HOA dues.
What Data We Need From You
We simply need your property address, bedroom and bathroom count, approximate square footage, and general condition to produce a useful analysis. Providing accurate details ensures the most precise valuation.
Our minimum requirements include:
- Property address
- Bedroom and bathroom count
- Approximate square footage
- Year built or general age
- Current condition (move-in ready, needs cosmetic work, needs major renovation)
These basic facts allow us to pull the initial comps. We can refine the numbers even further if you provide a few extras.
Helpful additions include:
- Recent photos (especially the kitchen, bathrooms, and exterior)
- Recent rent history if you have rented the property before
- Upgraded smart home technology details (like an Ecobee thermostat or keyless entry locks)
- Anything unusual (a pool, an outbuilding, a large lot, or strict HOA constraints)
What the Analysis Does NOT Do
Our free analysis is not a formal appraisal, a physical capex inspection, a legal-compliance audit, or an HOA-rules deep dive. These tasks are separate engagements entirely.
We want to be clear about the boundaries of a market-rate rental report. The free analysis is definitively not a:
- Formal appraisal (a mortgage-grade valuation requiring a licensed appraiser)
- Physical capex inspection (assessing roof age, HVAC lifespan, or foundation integrity)
- Legal-compliance audit (verifying Durham County building codes)
- HOA-rules deep dive
Those specialized assessments happen at owner onboarding if you decide to engage full management. Our team focuses solely on market performance and rental yield during this initial stage.
You should hire a licensed local contractor if you need structural safety guarantees.
Turnaround Time
We return most analyses within 24 to 48 hours of receiving your complete property details. This fast turnaround helps you make timely decisions in a competitive Triangle real estate market.
Our process moves even faster when the property sits in a high-comp submarket. Neighborhoods like Trinity Park, Brier Creek, and the Cary tech corridor provide abundant daily data for a precise rental analysis Triangle NC investors rely on.
We experience slightly slower return times for thin-comp markets, such as rural eastern Alamance or highly specialty units. A broader comp set requires manual adjustments for property differences.
How Findings Translate Into a Recommendation
Our output gives you recommended pricing, ROI priorities, submarket context, potential red flags, and clear next steps. The final report is much more than a simple price tag.
We translate the raw data into an actionable strategy. Here is exactly what the findings provide:
- Recommended pricing with competitive reasoning based on 2026 local averages.
- Improvement priorities ranked strictly by return on investment.
- Submarket context detailing the specific tenant pool to expect in your zip code.
- Red flags if any exist, such as obvious comp gaps, condition issues, or limiting HOA rules.
- Next steps if you want to formally engage management.
You can take this analysis and execute self-management immediately. Our team is also happy to step in and handle the daily operations.
The report is genuinely yours to keep. A side-by-side comparison shows the practical difference between taking the data yourself versus hiring a professional team.
| Feature | Executing Self-Management | Engaging Our Team |
|---|---|---|
| Pricing Strategy | You set the final rent based on the report. | We monitor real-time shifts to maximize yield. |
| Renovation Execution | You source and manage all local contractors. | We dispatch vetted professionals automatically. |
| Tenant Placement | You handle marketing, showings, and screening. | We secure highly qualified renters for you. |
Common Triangle Submarkets We Have Deep Comp Data On
Our database includes deep comparable records for Durham, Raleigh, Cary, Morrisville, Chapel Hill, and Hillsborough. This extensive coverage ensures analysts can price units accurately across the entire Triangle.
We track neighborhood-level trends closely to spot emerging opportunities. Some of the most active submarkets include:
- Durham: Trinity Park, Hope Valley, Southpoint, East Durham, Old North Durham, Watts-Hillandale.
- Raleigh: Downtown, ITB, North Raleigh, Brier Creek, North Hills.
- Morrisville: Park West Village, Town Hall Drive corridor.
- Chapel Hill: Franklin Street, Meadowmont, Southern Village.
- Secondary Markets: Broader Wake and Alamance counties.
You need specialized knowledge to manage properties in these distinct zones successfully. For neighborhood-level investment analysis, see Best Durham and Triangle Neighborhoods for Rental Property Investment.
Our team also provides targeted support for newcomers. For first-time investor guidance, see Buying Your First Investment Property in the Research Triangle.
Getting a free rental analysis Durham experts prepare for you is the best way to start.
For the complete operational picture, see our investment property services.